Evaluation of flood risk in an arid region of southern Tunisia: Coupling hydrological and hydraulic modeling
Abstract
Flash floods are today more intense and more frequent due to climate change, especially in arid regions. This issue particularly threatens the Tataouine province, an arid area located in southern Tunisia, where sudden heavy flood events recorded during the last three decades have caused serious material damage and human life losses. The aim of this study is to assess flood risk in the Wadi Tataouine watershed by integrating a hydrological model, a hydraulic model and watershed physical characteristics. To proceed, a rainfall frequency analysis was performed using the Hyfran-Plus software to determine maximum daily rainfall versus return periods. The results of this analysis were afterwards used for hydrological modeling by the Watershed Modeling System (WMS) to develop a flood hydrograph. The latter served as a boundary condition for the two-dimensional hydraulic model HEC-RAS 2D. A flood hazards map was developed based on the obtained flood hydrograph and land cover manning coefficients that were used to determine inundation depth and water velocity distribution at the flooded area. The water depth map shows that the depth reached 4 m and the velocity values ranged up to 3.5 m/s. A flood vulnerability map was established using the physical characteristics of the Wadi Tataouine watershed. A flood risk map was developed by associating the flood hazards with the vulnerability map of the study area. The results of the applied integrated hydrological and hydraulic modeling approach suggest that urban areas, basically the Tataouine city, present the highest risk of flooding. This can be mainly explained by the increase of impermeability and the higher exposure of people, properties and infrastructure in these zones. Therefore, the flood risk map proposed in the present study can help decision makers identify the most threatened zones in the Tataouine region and develop targeted prevention measures and effective mitigation strategies for flood risk management.
Keywords: Flood risk mapping, hydrological model, hydraulic model, climate change, arid region
INTRODUCTION
Flash floods continue to make headlines because of their considerable and often dramatic impacts on societies and the environment. These events are historically considered to be the most destructive and frequently occurring climatic extremes in the entire world (Peng and Zhang, 2022; Shen and Hwang, 2019; Wahlstrom and Guha-Sapir, 2015). Extreme floods are a threat to property and infrastructure, soil resources, crop fields, wildlife habitats, and most importantly to the safety of people (Alfieri et al., 2017; Diakakisa, 2020; Hu et al., 2018; Yari et al., 2022).
Due to climate change, strong demography and increasing urbanization in coastal and river side cities, the risk associated with this phenomenon is found to be magnified today (Musolino et al., 2020; Nkeki et al., 2022). Projected climate and land use changes are hence likely to further affect the future flood risk areas (Gu et al., 2020; Janizadeh, 2021).
In Tunisia and especially in its southeastern regions, the irregularity and poor distribution of rainfall cause violent and episodic floods (Boujarra et al., 2021; Cantoni et al., 2022; Dahri and Abida, 2020; Ezzine et al., 2020). Throughout history, these regions have been affected by multiple extreme rains, causing human and material damage. The best-described and best-known events are those documented since the beginning of the last century, and particularly after the 1950s, mostly still recalled by Tunisians. The floods of December 1973 (Gulf of Gabes), March 1979 (Jeffara and the Matmata mountains), 1995 (Tataouine), October 1998 (the regions of Beni Khedache and Matmata), and September 2003 (Medenine) are examples of the most destructive floods (Fehri, 2014). Therefore, various authorities have often adopted flood assessment methods as suggested by earlier studies started in the 1960s, in providing a significant step forward to mitigate, so far as possible, the impact of flood events (Dahri and Abida, 2020).
The Tataouine region, located in southern Tunisia, does not escape flooding problems. For instance, the torrential rains that took place on September 24, 1995, in the Tataouine watershed caused considerable floods that affected the Tataouine city and its surrounding. The 1995 flood event consequences were heavy losses of human life (deaths of at least 20 people), agricultural areas and a destruction of many houses and offices (Boujarra and Ktita, 2009).
The heavy rain that fell during the 16th of December 2016 caused significant damage in many districts of Tataouine. The daily recorded precipitation was around 56 mm. The rains caused material damage in the city and its surrounding area, as well as collapse of many roads. The rainy season has returned with its damage, on 17 November 2017, caused material damage and submerged roads. The daily rainfall was over 62 mm. Furthermore, the rapid urbanization expansion of the Tataouine city in various directions added to the lack of comprehensive plans allowed numerous flood events due to heavy rainfalls to cause heavy damage across the city. This highlights the deep shortage in terms of flood risk assessment and mapping in the region. Therefore, an accurate flood modeling at a watershed scale is highly needed for the evaluation of flood risk in the study area.
There are various methods applied for flood risk assessment (Peng and Zhang, 2022). Innovative approaches are rising in number and diversity (e.g., Sermet et al., 2018; Tanguy et al., 2017). Coupled hydrologic‐hydraulic models provide highly accurate calculation results (El-Saoud and Othman, 2022; Hasan et al., 2019). Combing flood modeling with hydrological models has been playing an important role in informing decision-makers on flood prevention and control but also on developing risk mitigation strategies (Ben Khalfallah and Saidi, 2018). As simplified by Grimaldi et al. (2019), “hydrologic models are used to predict discharge hydrographs, which are then used as input to hydraulic models for the prediction of floodplain inundation dynamics”.
The main objective of this work is to estimate the extent of floodplain inundations in the Wadi Tataouine watershed, in order to create management plans for flood risk and to reduce thereby the impacts of extreme flood events in the region.
Different datasets were prepared and georeferenced using the UTM coordinate system, zone 32 within ArcGIS environment in order to achieve the study goals: a 30 m resolution DEM, a soil map, a land use map and a series of rainfall data. A coupled hydrological (WMS) and hydraulic (HEC-RAS 2D) in association with the elaboration of a land use map was used to generate a flood hazards map. A vulnerability map was established using a physical characteristic of the Wadi Tataouine watershed. Finally, the results of the modeling are used to generate hazard and vulnerability maps that were associated to establish the risk map.
MATERIALS AND METHODS
Study area
The province of Tataouine is located in the south of Tunisia (Figure 1). It is the largest governorate in the country, which covers a total area of 38889 km², corresponding to 24% of Tunisian territory area. The Tataouine Wadi watershed, object of this study, is located in the intermediate space between the Dhahar and the Jaffara, at the center of the Matmata chain. It covers administratively the Tataouine city and its surrounding zones, draining an area of 453 km2 (Figure 1).
The study area is a plain surrounded by high altitude that even exceed the 500 m northwest and southwest side of the basin (Figure 1). The Tataouine city is at an altitude of 300 m, which favors the interception of all the runoff comes from the three sides: northwest, southwest and the South of the watershed thus explaining the problem of flooding of the study site. The Tataouine watershed is the result of a hydrographic system, which arises on the heights of Djebels Charenn, Nekrif, Taderekt in the south-west. The hydrographic network of our study area is very branched (dense) and full of tributaries. Those tributaries gather in the main stream “Wadi Tataouine” (Figure 1).
In terms of geology, the substratum of the Tataouine region is marked by the development of secondary age sedimentary series arranged by a succession of outcrops. The structure is composed of variable rocks (clay, marl, sandstone, conglomerate, dolomites, and limestone). The framework of the landscape consists of structural reliefs formed of hard rocks; the soft rocks form valleys and depressions (Richard, 1985).
Climatically, the study area is characterized by a low and irregular rainfall, with an average of around 138 mm in 2019, which places it in the arid region. The irregular rainfall regime results in frequent dry periods and in some cases very severe and even long-lasting drought periods. The irregularity is inter-seasonal but also inter-annual. The region witnesses a wet year out of five on average. Rainfall occurs mainly from September to April, giving rise to a dry season, which extends until August (Figure 2).
The Tataouine watershed was touched by severity flood events. It was the consequence of the severity rainfall (Affouri et al., 2016). Figure 3 shows five precipitation events were recorded between 1900 and 2000. It illustrates that, generally the rainfall is low, with an annual average that does not exceed 150 mm (Affouri et al., 2016).
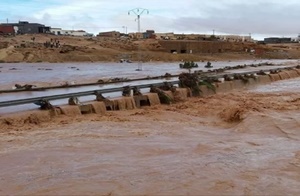
Numerous flood events have caused great damage in the Wadi Tataouine watershed. Infrastructure such as bridges and roads in was heavily impacted (Figure 4).
Soil and land use data
Soil of Wadi Tataouine watershed
The soil map of the study watershed (Figure 5) which was extracted from the agricultural map of Tataouine according to the French soil classification (Richard, 1985) shows five main soil classes:
• Raw mineral soils “sols minéraux bruts” (non-climatic): soils of this class are those of deserts, organic matter is practically absent but not biological activity. There is no evolution of the mineral matter, which remains at the rough state often mechanically fragmented.
• Poorly developed soils of non-climatic origin “sols peu évolués”: mostly match to areas rejuvenated by erosion (poorly eroded soils) or soils resulting from streams.
• Calci-magnesium soils with gypsum accumulation “sols calcimagnésiques à accumulation gypseuse”: these soils depend on calcium, magnesium carbonates and sulfates. These are thin soils.
• Isohumic soils “Sols isohumiques”: these are characterized by a gradually decreasing content in profiles of organic matter. Those are saturated soils of subtropical and frequent climates in the Mediterranean area: chestnut soils, subtropical brown fools and sierozems.
• Halomorphic soils “Sols halomorphe”: these soils are all highly salty.
Land use map
The land use classification was derived from semi-automatic plugin under QGIS software using satellite image Landsat by the supervised classification method. This method allowed classifying the land use of our study area for the baseline year (1996) and the target year (2017) into five main classes: Artificial surfaces, Cropland, Grassland, Wetland and Bare soil.
The land use map of the 1996-year (Figure 6a) shows that croplands are scattered over the whole area. The cropland class (30% of the space), mostly refers to the traditional agriculture. Grasslands are found in the mountains as well as the plains. The downstream of the study area is occupied by artificial surfaces (1.7%) where located Tataouine city and bare soil present 26.3%.
The classification results of the year 2017 (Figure 6b) reveal that the study area is occupied by the five classes: cropland, grassland, artificial surfaces bare soil and wetland. Statistically, bare soil occupies the largest area with a percentage of 39% (147.86 sq.km), this can be explained by the concentration of populations near the Wadi and the periods of drought, which characterize the region. The accuracy assessment of the land cover classification results obtained for 2017 showed an overall accuracy of 82.43%. The Kappa coefficient was approximately 0.6. According to the statistical results obtained, we can notice that the urban area was increased from 1,7% in 1996 to 4% in 2017.
Frequency analysis of rainfall data
Historical rainfall records for the 1961-2019 period were obtained for the available meteorological station (CTV Tataouine station), located in the downstream of the watershed. The characteristics of station are given in table 1.
The statistical analysis is based on a maximum daily rain series for 48 years. The adjustments of the sample were examined with the HYFRAN-PLUS software using the Decision Support System (DSS). The first step was to introduce the series of maximum daily rainfall during the 48 years. The characteristics of this series are shown in table 2.
After introducing the maximum daily rainfall data, the hypotheses of independence, homogeneity and stationarity were tested using the Wald-Wolfowitz, Wil-coxon and Mann-Kendallal statistical tests.
Hydrologic modeling
For any hydrological study on an ungagged watershed, a methodology has to be selected for the determination of runoff at its outlet. The Watershed Modeling System (WMS) is an integrated system of software designed for interactive use in a multitasking environment. It was developed by the Environmental Modeling Research Laboratory of Brigham Young University in collaboration with the US Army Corps of Engineers and is currently being developed by Aquaveo (Aquavo, 2014). The Tataouine watershed was delineated with the help of WMS from an ASTER GDEM DEM of 30 m resolution extracted from the “Global Data Explorer” (Figure 1).
Determination of the concentration time (Tc)
To calculate the concentration time, WMS is based on the following relation ((Hydrologic Engineering Center, 1998):
(1)
Where Tc is the time of concentration (h); L is the flow length (m); and Δh is the difference between the minimum and maximum heights of the region (m).
Here, the difference between the minimum and maximum heights of the region is derived from the following relation (determined previously in the watershed characteristics part):
(2)
Precipitation design depending on the concentration time and return period P (Tc, T)
Based on the estimation precipitation with HYFRAN-PLUS, WMS determine the precipitation with the following relation:
(3)
Production function: Estimation of excess rainfall hyetograph
The precipitation is split into two parts. Parts of it flows (surface runoff) on the surface of the basin, while the rest is absorbed as infiltration or evaporated. Rainfall that flows and causes flooding on the surface of the basin is called excess rainfall.
Based on the SCS method, the excess rainfall given by the WMS software is calculated by:
(4)
Where Q is runoff (mm);
S is the potential maximum soil moisture retention after runoff begins, it is determined by the relation:
(5)
Transfer function: Determination of the synthetic unit hydrograph using HEC-1 model
The HEC-1 is a hydrological model (Hydrologic Engineering Center, U.S.A), supported by the Watershed Modeling System software (WMS) and it uses a set of synthetic unit hydrograph methods, such as SCS method. The synthetic unit hydrograph presents an approach for determining the peak flood discharge of a watershed for different return periods.
The design flood hydrograph was calculated based on excess rainfall duration and design rainfall hyetograph when the basin unit hydrograph was derived. Peak flood discharge was estimated using empirical method (Rationale’s method).
Hydraulic modeling
The HEC-RAS is a free, user friendly, constantly upgraded, easily GIS-integrated software developed by U.S. Army Corps of Engineers (US Army Corps of Engineers, 2016) that has been extensively used for flood modeling (Ben Khalfallah and Saidi, 2018; Ezz, 2018; Thapa et al., 2020).
The 2D HEC-RAS modeling consists of a series of tools and procedures that allow as to reach the objective of this work. It is synthesized in the figure below (Figure 7).
This model used the manning empirical formula to calculate and simulate the water surface elevations, flow velocities, flow depths and spread of the flash flood events based on the standard step method.
The use of the 2D HEC RAS allowed us to carry out a two-dimensional simulation of the flood of November 2017 in Tataouine and to predict the floodplain of our study zone. The simulation provides us with information such as the depth and the velocities, which will be useful for the creation of the flood map.
Vulnerability map
The method for establishing the vulnerability map consists of combining different indices in order to determine the most vulnerable area is to flooding. The figure 8 summarizes the methodology.
The classification results are given in the figure 9.
The slope plays a crucial role in assessing the danger of runoff, so it is involved in the study area’s vulnerability to flooding. The slope classification was made according to the classification of Cherif et al. (1993) (Table 3).
The figure 9a shows that the downstream watershed and more precisely the city of Tataouine is the most vulnerable to flooding.
In terms of vulnerability to flooding, permeability plays a very important role. Three lithological classes characterize the Tataouine watershed: clay, silt, and sand. According to Sageri (1998), it is possible to classify lithological facies by permeability as shown in Table 4.
The figure (Fig. 9 b) presents the variance in the susceptibility to flood risk, based on the lithological index criterion. There is an area upstream of the study site that presents a very high risk with low permeability causing the appearance of considerable amounts of runoff. While the other areas show a low sensitivity to the risk of flooding.
The drainage density is based on Horton’s formula (Horton, 1933):
(5)
Where Dd is the drainage density (km/km²); Li is the length of watercourse (km); and A is the area of the sub-watershed (km²).
The watershed is devised into 4 sub-watersheds according to the order of the tributaries. Therefore, Horton’s formula was applied to each sub-watershed. The calculation results are shown in Table 5.
The sub-watershed with the largest surface has the most sensitive areas to flooding, due to the dense hydrographic network as shown by the sensitivity map depending on drainage density (Figure 9 c).
In assessing the vulnerability of the land to flooding, the nature of the land cover is very important. The land cover can categorize land sensitivity (Table 6).
The figure (Figure 9 d) shows that the downstream watershed and more precisely the city of Tataouine is the most vulnerable to flooding.
RESULTS
Frequency analysis of precipitation
The results of the adjustments examined by the different models (Gumbel, Gamma, GEV, and Log-Pearson type 3) are presented in the following figure (Figure 10).
The numerical method consists in comparing between values of the Bayesian Information Criteria (BIC) and Akaike (AIC). The best fits correspond to the lowest values of these statistics, so in our case the GEV law is best suited for estimating maximum mean intensities (Table 7).
The results of this study show that the highest quantiles are obtained by the GEV method. The quantiles are then calculated for the return periods 2, 3, 5, 10, 20, 50 and 100 years. Thus, the adequacy of this law is verified for all the series by the test of Chi-squared and the DSS (Table 8). The two criteria of BIC and AIC confirm the choice of the GEV method.
Synthetic hydrograph estimation using WMS model
The delineation process played an important role in the analysis of the catchment in finding hydrological parameters, to generate runoff effects of rainwater and tracking the stream flow in the watershed by the DEM (Figure 11).
According to the SCS method, the first step is to fix the time of concentration of the studied area. In fact, it is estimated to 7.18 h. Then, for the estimated precipitation, we present the result in the table below (Table 9).
To determine the mean CN coefficient on the surface of the watershed, the surface geological status of the basin, vegetation, and land applications were studied. Thus, we find the average value of (CN) which was estimated to 62.1811. The figure below presents a report of the CN estimation (Figure 12).
For the next step, rainfall hyetograph was estimated depending on the SCS distribution method on the WMS watershed. The figure 13 presents the distribution of the rainfall related to time unit.
After entering all the necessary data, the design hydrograph was created for different return period (Figure 14).
Estimation of peak flood discharge using WMS
The peak flood discharge was estimated in relation with different return periods (Table 10).
Estimation of peak flood discharge using empirical method (Rationale’s method)
After all calculation done and considering that Tc=7.18 h, we present the peak flow result in the table below (Table 11).
The results of two methods (SCS and empirical methods) are very similar. Therefore, the hydrographs created by the WMS software are verified. However, the SCS method is closer to reality since it highlights all the components that intervene in the phenomenon of runoff and the formation of flooding. Then, it can be pushed closer to the actual values if the watershed concentration time is calculated more accurately.
Hydraulic modeling
The results of WMS model were used as a boundary condition for running HEC-RAS 2D. The hydrological simulation results were used as a boundary condition for hydraulic simulation. Fig. 15 shows a water depth simulation using a HEC-RAS model.
Depending on the result of the depth map, we may note that the depth reaches 4 m in the Tataouine city watershed downstream. At the upstream of the watershed, the depth is not greater than 1 m. The repair of the velocity values in the study area during the 2017 flood is represented by the figure below (Figure 16).
We can notice that the velocity values are relatively low (less than 4 m/s) during the 2017 flood, possibly due to the low slope at the wadi Tataouine level and the position of the dam that stabilizes the runoff speed. The highest velocity, however, is just around the Tataouine city.
Hazard map
In our case, we are interested in studying the flood hazard relative to the various return periods (10 years, 50 years and 100 years).
The creation of the hazard map data for this study is based on the specific energy (E) classification. As follows, the basic energy equation is (Caradot et al. 2010):
(6)
Where E is the specific energy; h the water depth (m); v the velocity of the flood wave propagation (m/s); and g the gravity acceleration (m/s²).
In order to apply the specific energy formula and define the flood hazard, we will use the depth map and the velocity distribution map from different return period. Table 12 shows the classification of specific energy with respect to its degree of gravity.
The specific energy for the 10-years return period of this flood is very low which results in a zone without risk of flooding. The same classification is assigned for the return period of 50 years and it shows that the most critical values of the specific energy are concentrated at the downstream level of the watershed, which causes potential harm to the town of Tataouine.
According to figure 17, the Tataouine city has high specific energy values for the 100- years return period, which causes enormous damage on the scale of urban areas, due to the low position of the downstream of the watershed regions.
Vulnerability map
The vulnerability map production results from the superposition of slope index, drainage density and lithology.
Overlay coding between slope index and drainage density
At first, the overlay coding between the terrain sensitivity map depending on the slope index and the terrain sensitivity map depending on the drainage density was established. It was coded within the classification criterion of Muller (1997).
The first combination made between the indices shows that the majority of the study area is very sensitive to flooding (Figure 18).
Second coding (slope-drainage density-lithology)
The second coding of the classification indices is between the first coding result (slope_ drainage density) and the classification map according to the lithological index. The classification according to (Muller, 1999) is given in the following table (Table 14) and shown in Figure 19.
Vulnerability map
The result of the other combinations is used after superposition for the determination of the vulnerability map (Tables 15 and 16).
The resulting vulnerability map shows that the areas of high to very high vulnerability are concentrated downstream of the watershed (Figure 20).
Flood risk map
This map is the result of the superposition between the hazard map and the vulnerability map (Table 17).
Thus, the zones of the study site can be classified according to their types of risk (Table 18).
The flood risk map was developed for the 100 years return period (Figure 21).
DISCUSSION
The flood risk map
The flood risk map of the Wadi Tataouine watershed shows that the floodplain inundated areas increased with the magnitude of the flow, which confirms the high level of flood risk for areas near the Wadi in the Tataouine watershed. The uncontrolled urbanization within the watershed contributes to the increase in impermeable areas and then to runoff, which explains the specific increased risk in the Tataouine city. Moreover, the higher presence of people, properties and infrastructure can also contribute to the higher flood risk presented by the urban areas.
The flood risk map is thereby an essential part of defining flood mitigation measures because it identifies the area on which we need to focus mitigation efforts.
Limitations and recommendations
First, we notice that The WMS model simulated fairly well the peak flows. However, there were difficulties in attributing time steps specified to run the HEC-RAS 2D model. In that case, the hydrograph of observed flow is more abrupt in comparison with the simulated hydrograph. The installation of pluviographs and hydrographs in several places of the Tataouine Wadi would facilitate the modeling process.
In addition, the drainage systems in the Tataouine city are designed with a 10-year storm, but our results showed that even 10-year precipitation could cause damages and exceed the drainage capacity. Therefore, there is a need to repair and resize the drainage installation.
In order to reduce the speed of the flow, the installation of water and soil conservation structures must be reinforced. Moreover, it was found that community is not engaged within the floodplain management. Therefore, a participatory approach is essential because a sense of ownership is developed only if communities become participate in data collection for flood prediction. Community integration would hugely improve the data availability in the watershed and better inform the community in terms of flood damage prevention.
CONCLUSION
Since the recent development of hydrological models, hydrodynamic models, and GIS technologies, flood modeling helps to produce various maps showing the depth, extent, and context of the flooded area to support decision-making by local planners and government.
The main objective of our study was to create a flood map of the Tataouine watershed (South of Tunisia) to enhance current prevention practices against losses during flooding periods across the region communities. GIS-integrated hydrological and hydraulic modeling supported the development of the flood risk map.
To achieve our goal, different steps were followed. We extracted watershed physical characteristics as well as hydrologic information to prepare WMS model inputs. The discharge result obtained from WMS simulation were used with the land cover map created using SCP plugin in QGIS software to compute and produce flood map for 100-year return period flood.
From the hydrological result, the projected peak discharge could be used in the watershed for design purposes. In addition, it is important to note that hydrological modeling based on GIS is useful because it enables analytical time to be reduced and enhances the accuracy of hydrological studies. On the other hand, the hydraulic modeling results showed that most parts cities of Tataouine watershed are vulnerable to flooding.
Although some initiatives have been taken by the government, such as the creation of the Ksar Ouled Debbab dam in 2011. However, it is not sufficient to face the flood risk in the region. Stakeholders along with local authorities are called to introduce a flood emergency management plan for the communities to improve flood disaster awareness and mitigation and for an overall better management of the Wadi Tataouine watershed.
Future studies may focus on the suggestion of suitable measures that could enhance resilience and on providing a fitting planning of the expansion of urban areas…
REFERENCES
Affouri A., Dezileau L., Kallel N. (2017). Extreme flood events reconstruction during the last century in the El Bibane lagoon (Southeast of Tunisia): A Multi-proxy Approach. Clim. Past, 13: 711–727.
Alfieri L., Bisselink B., Dottori F. (2017). Global projections of river flood risk in a warmer world. Earth’s Future, 5: 171-182.
Aquavo (2014). WMS User Manual (v10.1). http://wmsdocs.aquaveo.com/WMS_User_Manual_(v10.1).pdf.
Ben Khalfallah C., Saidi S. (2018). Spatiotemporal floodplain mapping and prediction using HEC-RAS-GIS tools: Case of the Mejerda river, Tunisia. Journal of African Earth Sciences, 142: 44−51.
Boujarra A., Lahmar L., Aliouet S. (2021). The catastrophic floods of September 23, 2009 in Redeyef (southern Tunisia). Physio-Géo., 16: 87−105.
Boujarra A., Ktita H. (2009). Les facteurs de l’amplification de l’inondation de la ville de Tataouine le 24 septembre 1995 (Sud-Est tunisien). In: Risques naturels en Méditerranée occidentale, actes de colloque (Carcassone), M. Fort et F. Ogé, Progic, Paris, p. 195-206.
Cantoni E., Tramblay Y., Grimaldi S. (2022). Hydrological performance of the ERA5 reanalysis for flood modeling in Tunisia with the LISFLOOD and GR4J models. Journal of Hydrology: Regional Studies, 42: 101169.
Caradot N., Granger D., C. Rostaing C. (2010). L'évaluation du risque de débordement des systèmes de gestion des eaux urbaines. Contributions méthodologiques de deux cas d’études (Lyon et Mulhouse). Techniques-Sciences-Méthodes, 6: 58–67.
Dahri N., Abida H. (2020). Causes and Impacts of Flash Floods: Case of Gabes City, Southern Tunisia. , 13: 176.
Diakakis M., Deligiannakis G., Antoniadis Z. (2020). Proposal of a flash flood impact severity scale for the classification and mapping of flash flood impacts. Journal of Hydrology, 590: 125452.
El-Saoud W.A., Othman A. (2022). An integrated hydrological and hydraulic modelling approach for flash flood hazard assessment in eastern Makkah city, Saudi Arabia. Journal of King Saudi University – Science. 34: 102045.
Ezz H. (2018). Integrating GIS and HEC-RAS to Model Assiut Plateau Runoff. The Egyptian Journal of Remote Sensing and Space Science, 21: 219–227.
Ezzine A., Saidi S., Hermassi T. (2020). Flood mapping using hydraulic modeling and Sentinel-1 image: case study of the Medjerda basin, northern Tunisia. The Egyptian Journal of Remote Sensing and Space Science, 23: 303−310.
Fehri N. (2014). L’aggravation du risque d’inondation en Tunisie : éléments de réflexion. Revue Tunisienne de Géographie physique et environnement, 8,: 149.
Grimaldi S., Schumann G. J‐P., Shokri A. (2019). Challenges, opportunities and pitfalls for global coupled hydrologic‐hydraulic modeling of floods. Water Resources Research, 55: 5277-5300.
Gu X., Qiang Zhang Q., Li J. (2020). Impacts of Anthropogenic Warming and Uneven Regional Socio-Economic Development on Global River Flood Risk. Journal of Hydrology, 590: 125262.
Hasan H.H., Mohd Razali S.F., Ahmad Zaki A.Z.I. (2019). Integrated hydrological-hydraulic model for flood simulation in tropical urban catchment. Sustainability, 11: 6700.
Horton R.E. (1933). The role of infiltration in the hydrologic cycle. Transactions of the American Geophysical Union, 14: 446-460.
Hu P., Zhang Q., Shi P. (2018). Flood-induced mortality across the globe: Spatiotemporal pattern and influencing factors. Science of the Total Environment, 643: 171−182.
Janizadeh S., Chandra Pal S., Saha A. (2021). Mapping the spatial and temporal variability of flood hazard affected by climate and land-use changes in the future. Journal of Environmental Management, 298: 113551.
Musolino G., Ahmadian R., Xia J. (2020). Comparison of flood hazard assessment criteria for pedestrians with a refined mechanics-based method. Journal of Hydrology X, 9: 100067.
Nkeki F.N., Bello E.I., Agbaje I.G. (2022). Flood risk mapping and urban infrastructural susceptibility assessment using a GIS and analytic hierarchical raster fusion approach in the Ona River Basin, Nigeria. International Journal of Disaster Risk Reduction. 77: 103097.
Peng J., Zhang J. (2022). Urban flooding risk assessment based on GIS- game theory combination weight: A case study of Zhengzhou City. International Journal of Disaster Risk Reduction, 77: 103080.
Sermet Y., Demir I. (2018). An intelligent system on knowledge generation and communication about flooding. Environmental Modelling & Software, 108: 51–60.
Shen G., Hwang S.N. (2019). Spatial–Temporal snapshots of global natural disaster impacts Revealed from EM-DAT for 1900-2015. Geomatics, Nat. Hazards Risk., 10: 912−934.
Tanguy M., Chokmani K., Bernier M. (2017). River flood mapping in urban areas combining radarsat-2 data and flood return period data. Remote Sensing of Environment, 198: 442–59.
Thapa S., Shrestha A., Lamichhane S. (2020). Catchment-Scale Flood Hazard Mapping and Flood Vulnerability Analysis of Residential Buildings: The Case of Khando River in Eastern Nepal. Journal of Hydrology: Regional Studies, 30: 100704.
U.S. Army Corps of Engineers (2016). HEC-RAS 5.0 2D Modeling Users Manual. https://www.hec.usace.army.mil/software/hec-ras/documentation/HEC-RAS%205.0%202D%20Modeling%20Users%20Manual.pdf.
Yari A., Zarezadeh Y., Ardalan A. (2022). Deadly floods and their causal factors: A case control study in Iran between 2005 and 2008. International Journal of Disaster Risk Reduction, 77: 103036.